Features
Everything You Need to Monitor Everything
26 monitor types, 11 alert channels, multi-region checks, private workers, and more. The most comprehensive monitoring platform at any price point.
Monitor Types
26 Ways to Monitor Your Stack
From simple HTTP pings to complex multi-step API workflows and Lighthouse audits.
Free (Included in All Plans)
HTTP / HTTPS
Monitor website availability, status codes, and response times.
Ping (ICMP)
Check if a host is reachable and measure latency.
SSL Certificate
Track certificate expiry dates and chain validity.
Domain Expiry
Track domain expiration, registration date, and last renewal via WHOIS.
Security Headers
Audit HTTP security headers like CSP, HSTS, and X-Frame-Options.
Mixed Content
Detect insecure HTTP resources loaded on HTTPS pages.
Multi-Step API
Chain multiple API requests into transaction sequences with variable extraction and assertions.
Network & Infrastructure
Port
Monitor TCP port availability on any host.
DNS
Verify DNS records resolve correctly — 10 types including A, AAAA, MX, TXT, SRV, CAA. Select multiple at once.
Heartbeat
Receive periodic pings from your services to confirm they are alive.
WebSocket
Test WebSocket connection handshake and message exchange.
FTP
Verify FTP server connectivity and authentication.
Email Protocols
SMTP
Test SMTP server connectivity and relay availability.
IMAP
Monitor IMAP mailbox server availability and login.
POP3
Check POP3 server connectivity and mailbox access.
Content & Security
Content Change
Detect when a page changes its visible content or HTML.
Blacklist
Check if your IP or domain is on DNS-based blacklists.
Broken Links
Crawl your site and find 404s and dead links.
Redirect Chain
Trace every redirect hop and verify the final destination.
Sitemap
Validate your XML sitemap structure and referenced URLs.
WHOIS Change
Detect ownership or registrar changes in WHOIS records.
API & Advanced
JSON API
Assert on JSON response body values with JSONPath expressions.
GraphQL
Execute GraphQL queries and validate response structure.
Lighthouse
Run Google Lighthouse audits for performance, SEO, and accessibility.
Screenshot
Capture screenshots to detect visual regressions. Full-page capture available on Business+ plans.
Browser Transaction
Record and replay real user journeys — login flows, checkouts, and form submissions in a real browser.
Multi-Region
Check From 5 Global Locations
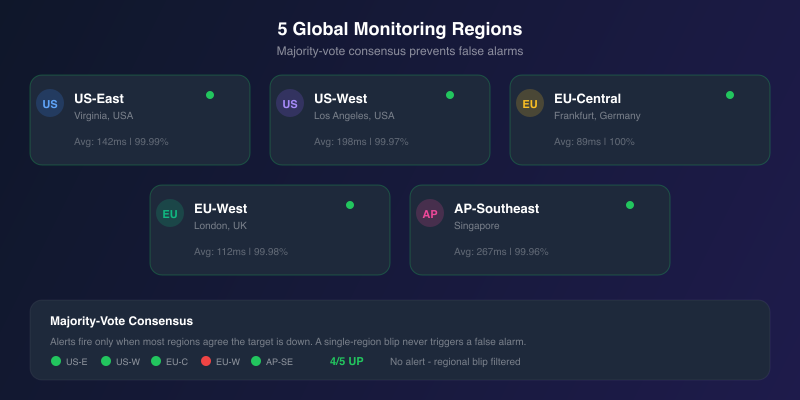
Every monitor check runs simultaneously from up to 5 regions around the world. We use majority-vote consensus: a monitor is only flagged as down when the majority of regions agree. This eliminates false alarms caused by temporary network issues in a single location.
- US East (Virginia)
- US West (Los Angeles)
- Europe Central (Frankfurt)
- Europe East (Vilnius)
- Asia Pacific (Singapore)
Zero False Alarms
Every Alert Is Verified Before It Reaches You
Nothing is worse than being woken up at 3 AM for a false alarm. Monitorion uses two layers of verification to ensure every alert represents a real problem — not a network hiccup, DNS glitch, or temporary blip.
Confirmation Rechecks
When a check fails, we don't alert immediately. Instead, we automatically run a confirmation recheck 30 seconds later. Only if the confirmation also fails do we create an incident and notify you.
Multi-Region Consensus
For multi-region monitors, every check runs from 5 global locations simultaneously. We use majority-vote consensus: your site is only flagged as down when 3 or more regions agree. A local network issue in one region won't trigger a false alarm.
The result: every alert you receive is a real problem that needs your attention — never a false alarm.
Alert Channels
10 Channels to Get Notified
Get alerted where you already work. Email, SMS, Phone Call, Slack, PagerDuty, and more.
Instant email notifications with rich HTML formatting and charts.
SMS
Text message alerts for critical incidents. Buy credit packs as needed.
Phone Call
Flash call alert — your phone rings from the Monitorion number. See it as a missed call and check your dashboard. Pro+ feature.
Slack
Post alerts to any Slack channel with actionable buttons.
Discord
Rich embed messages posted to your Discord server channels.
Telegram
Instant messages to your Telegram bot or group chat.
Microsoft Teams
Post alerts to Teams channels via incoming webhooks.
Google Chat
Deliver alerts to Google Chat spaces via webhooks.
PagerDuty
Trigger and resolve PagerDuty incidents automatically.
Jira
Auto-create and resolve Jira issues when incidents occur.
Webhook
Send JSON payloads to any URL for custom integrations.
Platform
Built for Serious Teams
Public Status Pages
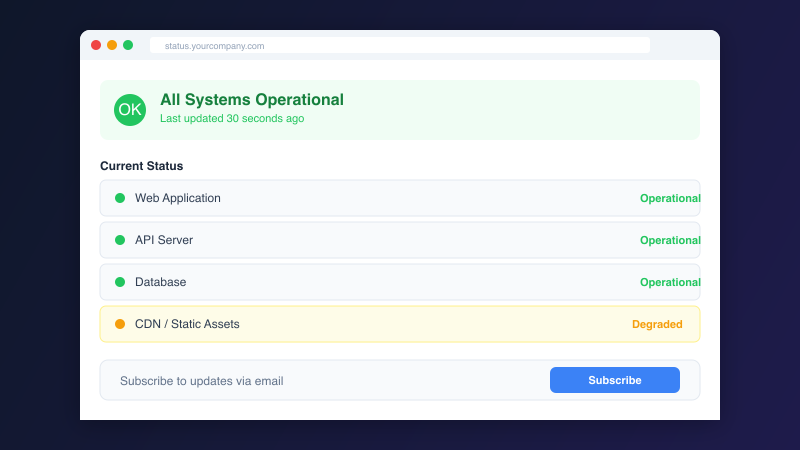
Create branded status pages your customers can subscribe to. Automatic incident detection, real-time updates, and email subscriptions.
- Custom branding
- Custom domains (Business+)
- Email subscriptions
- Real-time auto-updates
- Incident timeline
Private Workers (Open Source)
Monitor internal services behind your firewall with our open-source worker agent. No inbound firewall rules required -- the worker polls for jobs.
- Open-source (MIT)
- Docker-first deployment
- No inbound ports needed
- Monitor private IPs
- Automatic registration
SLA Reporting
Track uptime SLAs per service with automated reports. Export to PDF or CSV. Perfect for client-facing accountability.
- Per-service SLA tracking
- Automated PDF reports
- CSV data export
- Custom date ranges
- Per-tenant reporting
Team Collaboration
Organize monitors into projects and invite team members with role-based access control.
- Multi-project organization
- Role-based permissions
- Team member invitations
- Shared alert channels
- Activity audit log
REST API
Full CRUD API for monitors, alerts, incidents, and status pages. Automate your monitoring setup with our developer-friendly API.
- Full CRUD operations
- API key authentication
- Webhook event delivery
- Rate-limited & documented
- Available on Pro and higher
Incident Management
Automatic incident detection and tracking with MTTR calculation, timeline view, and deduplication. One-click acknowledgment suppresses alerts for 30 minutes while you investigate.
- Auto-detect incidents
- Chronological timeline
- MTTR calculation
- Incident deduplication
- Maintenance windows
- One-click acknowledgment
- 30-min alert suppression on ack
On-Call Scheduling
Built-in on-call rotation and escalation policies — no PagerDuty subscription needed. Set a weekly schedule per project and let Monitorion automatically page the right person.
- Rotating weekly schedules
- Date overrides for vacations
- Up to 3 escalation steps
- Delay-based step escalation
- Page on-call, specific user, or everyone
- Automatic project-level trigger
Weekly Email Reports
Every Monday morning, get a summary of the past week across all your monitors — uptime percentage, incident count, and average response time per service. Opt out anytime from Settings.
- Per-monitor uptime %
- Incident count & MTTR
- Avg response time trend
- Sent every Monday morning
- Opt-out from notification settings
Multi-Language Support
Monitorion supports multiple languages. The entire dashboard, alerts, and documentation can be translated to your preferred language.
- Full i18n support built in
- RTL language support
- Admin-managed translations
- Per-user language overrides
Ready to Monitor Everything?
Start with 15 free monitors. No credit card required. Upgrade anytime to unlock all 26 monitor types and 11 alert channels.